London Marathon 2023: A Data Round up
Insights from the London Marathon finisher timing data
The TCS London Marathon is an iconic running event, attracting elite runners and amateur athletes from all over the globe. With 48000+ finishers, it is one of the most popular marathons, next only to TCS New York City Marathon. We took a deep dive into the timing data (sourced from the official website), to uncover key trends and observations.
If you’re a running enthusiast, a data geek, or simply curious about the world of marathon running, you’ll find something of interest in this data round-up.
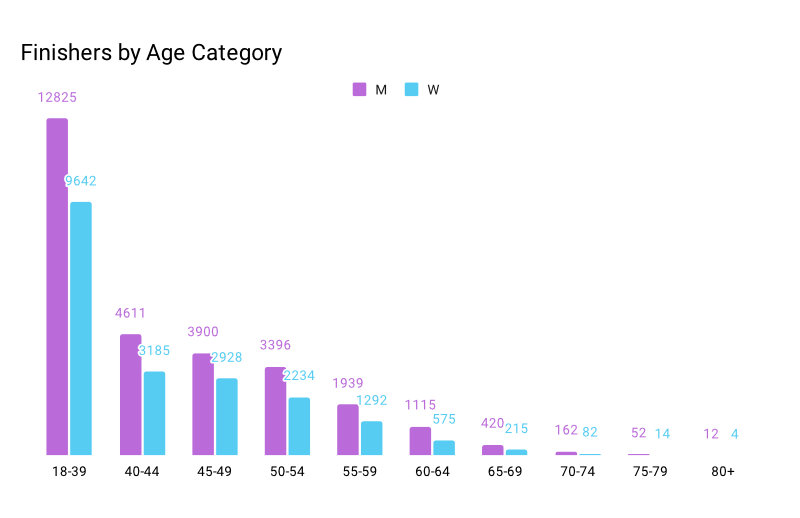
Finishers by Age Category
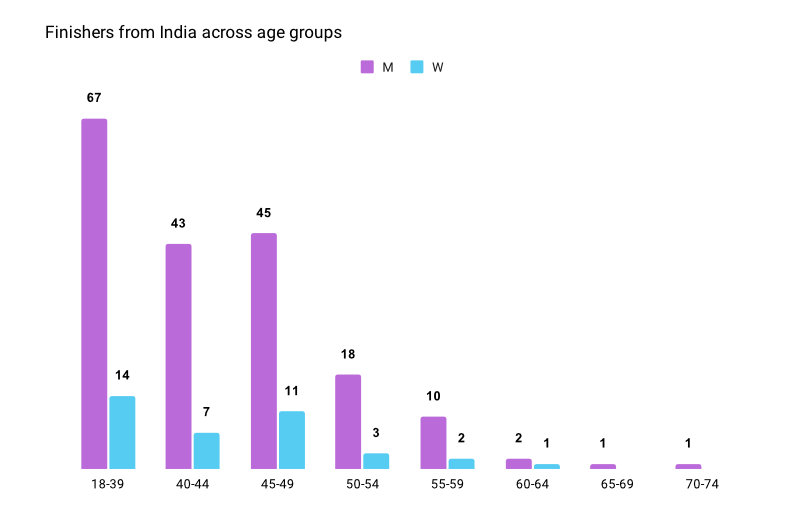
Similar to other World Marathon Majors, age category classification is only for 40 years and above. So 18-40 years is the open category, and then the age categories start with 5 year increments. On the other hand in India, we typically see age category classification starts from 25 (18-25, 25-30, etc.,). So, as one might expect, at London marathon the 18-40 age group has the highest number of finishers, and the numbers gradually decrease as the age increase.
Women Finishers
There is an excellent distribution between men and women finishers, with women making up almost half the finishers. It’s encouraging to see such strong women participation in one of the world’s most prestigious marathons.
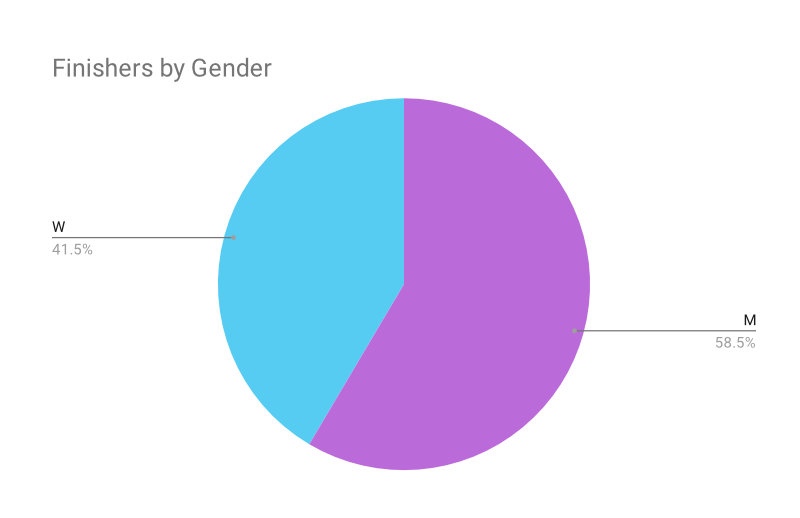
Typically, marathon participation in India is heavily skewed towards men, with women making up less than 10% of finishers. This underlines the need for more initiatives to encourage women to take up running and participate in races in India.
Finishers by Country
There are finishers from 148 countries in total, representing all the continents and various pacific islands. If we exclude the UK (host country), we can see that the majority of finishers come from countries in North America, Europe, South America, and Australia. USA has the highest number of finishers with 3217.
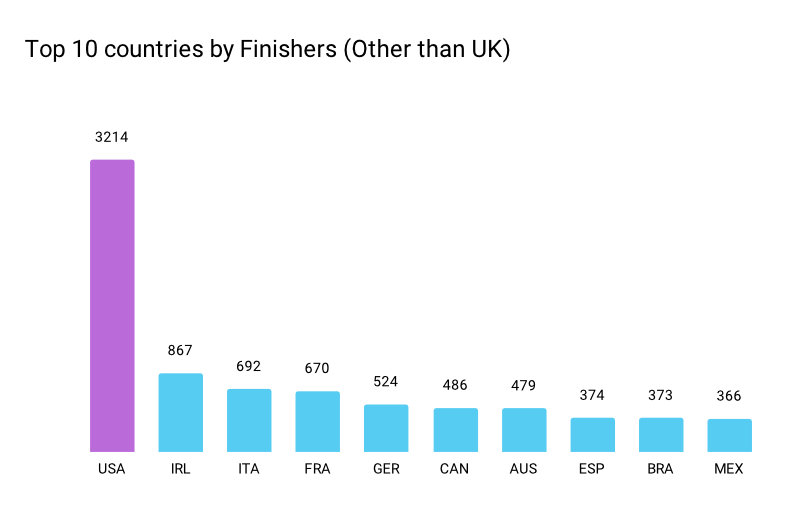
Interestingly, the only African country in the top 20 list is South Africa. Asian countries like Thailand, China, Hong Kong, and India also made it to the Top 20 list in that order. This highlights the global appeal of the London Marathon and how it attracts participants from all over the world.
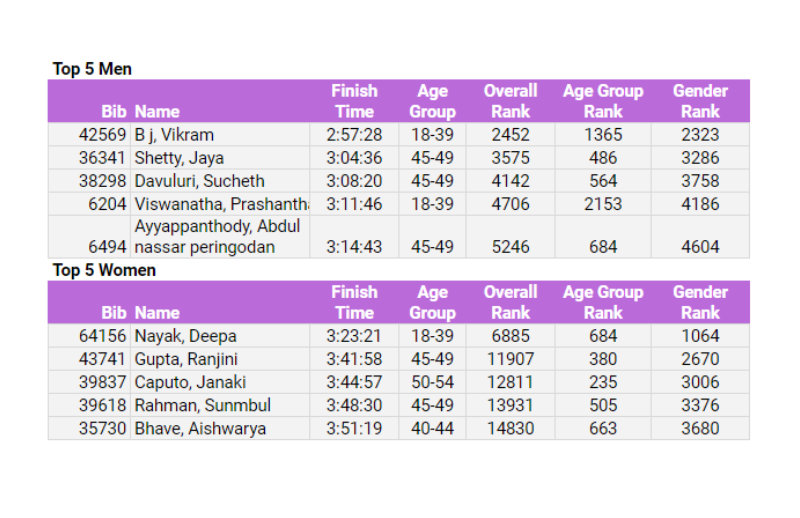
Finishers from India
India had a total of 225 finishers. In terms of the number of finishers from Asia, India ranks 3rd after Thailand, and China. Overall, India ranked 17th in the number of finishers in the London Marathon 2023, which is a significant improvement from previous years.
Distribution of Runners by Finish Time
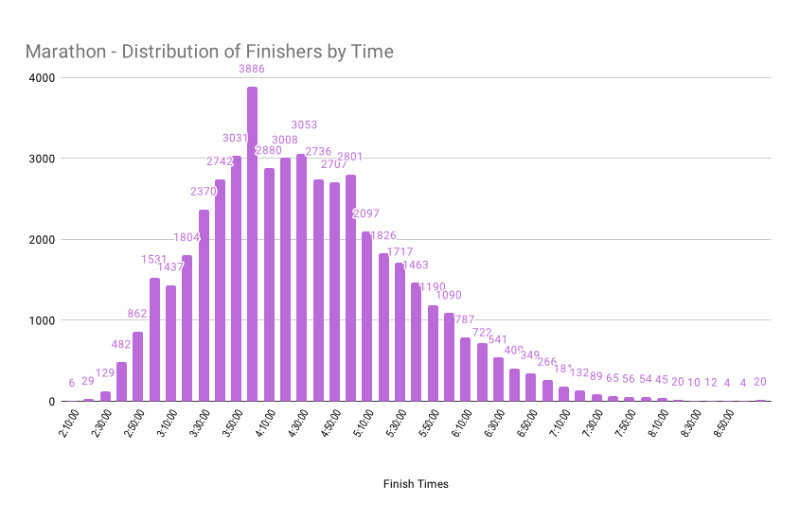
The distribution of runners by finish time is an interesting aspect to analyze. Most of the finishers fall under the 3:50 to 4:00 hours bin, with 3886 finished in this bin. In contrast, in Mumbai marathon 2023, the highest number of finishers are in the 4:50 to 5:00 hour bin. This could be due to various factors such as higher bar to entry, weather conditions, training methods, and the level of fitness of the participants.
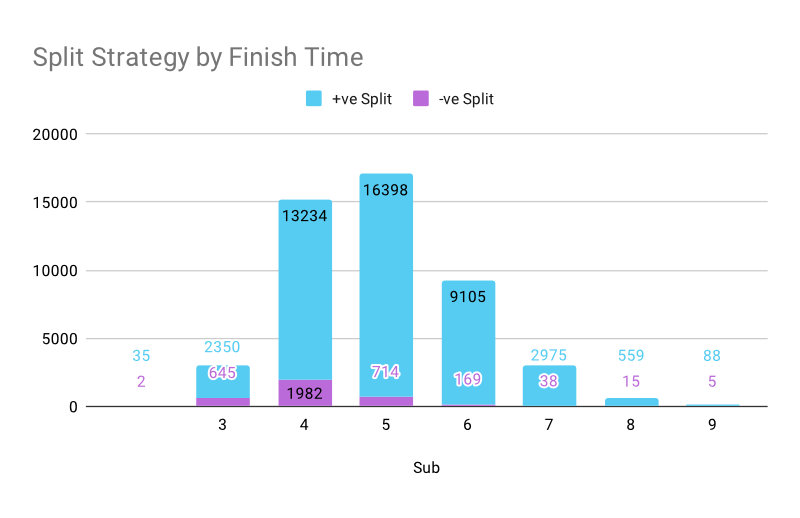
Split Strategy
7.4% of the finishers employed a negative split strategy, which means they ran the second half of the race faster than the first. This is higher than the 4% of finishers who employed a negative split strategy in the TMM 2023. It’s interesting to note that most of the negative split finishers at the London Marathon completed the race under four hours.
How does it compare to Boston?
Comparing Boston Marathon 2023 data to London Marathon data is interesting, given both happened a week apart.
- London marathon is way bigger with 48,000 finishers, compared to 27,000 finishers.
- More negative splits at Boston; 11% compared to London’s 7.4%
- Men to women finisher ratio at Boston is almost the same as London.
Which is faster? London or Boston?
Boston and London are two difference courses. It is well known that Boston’s course is much harder due to its rolling nature. But we want to see what could be the effect of the course difficulty on finish times. We did look at the average finish times of Top 10,100,500 and 1000 finishers.
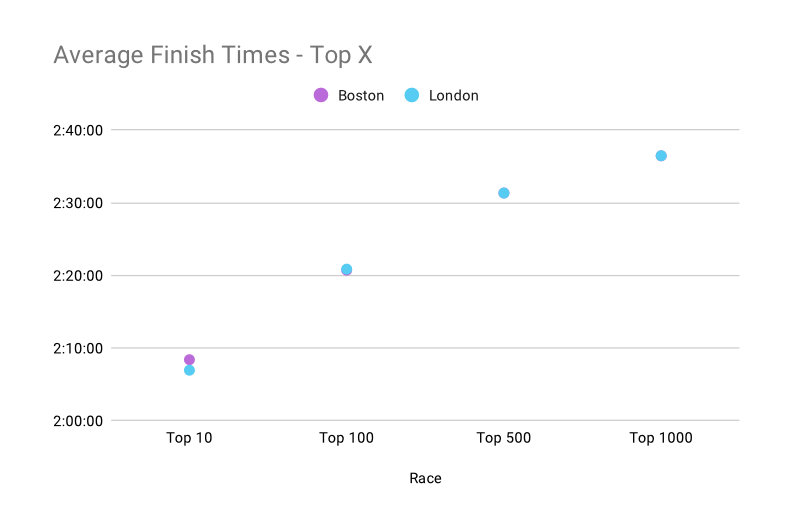
For the Top 10 finishers, average finish time of London is faster by 1m:27s. However, for the Top 100, 500, and 1000 finishers, the average finish time exactly same on both the course. Is that just a random coincidence?
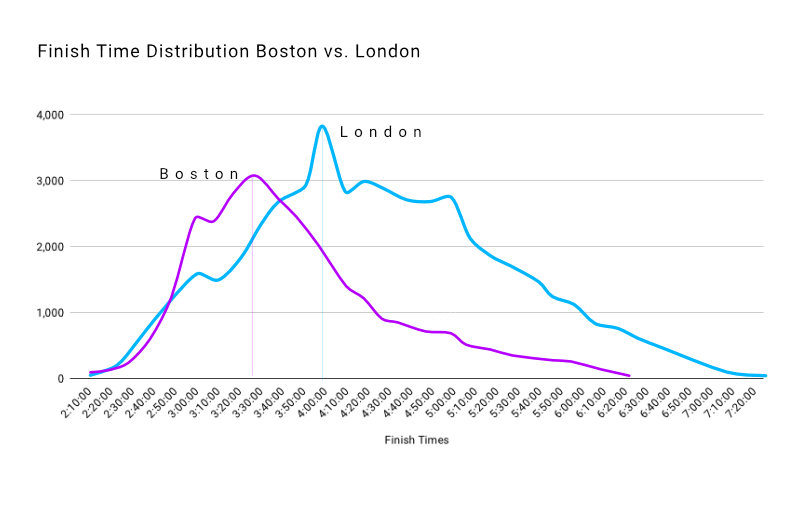
But if we look at finish time distributions, the highest number of finishers at Boston are in the 3:20 to 3:50 time bin, with 3059 finishers in this bin, compared to 3:50 to 4:00 hour bin. Does this mean Boston is faster? Or the field at Boston is more competitive? We will go with the latter.

Rameshbabu is member of Mangalore Runners Club, and is coached by Runners360. He has been running for 10 years, and has run half marathons across the world. He aspires to run a marathon soon.

Aravind is a techie, running geek, and a marathoner. He is a CrossFit Level 1 Trainer. He loves all things technology and technology in running, with special interest in running form analysis.